that its practitioners use "evidence-based" interventions. However,
most of us do not understand what we are doing when we plug data into
SPSS and pull the crank. The more we look into the evidentiary force of
most statistics, the more certain it seems that plugging in and pulling
the crank produces the same end product as feeding hay and pulling the
tail.
Here is a good example of the problems involved in our use of statistics from The OFloinn:
Sunday, July 29, 2018
Numbers, We Got Numbers.
Or not.
Biology is sorely deficient in math when
compared to physics or chemistry, and is therefore a sort of Junior
Varsity member of Team Science -- at least from the 18th century,
Scientific Revolutionary perspective. You may recall that one of the
Pillars of that Revolution was the privileging of Mathematics as the
Language of Discourse for Science. See Descartes for details. (It is
possible to quibble with those details -- after all, if the only tool
you allow yourself is a hammer, all you will ever see is a nail, and by
restricting themselves to what was mathematically "visible," the
Scientists blinded themselves to that which was not measurable.) And so
we have equations for Newton's
Theory, Maxwell's Theory, Boyle's Theory, Einstein's Theory, and sundry
others. But we have, alas, no equations expressing Darwin's Theory.
Fair is fair. Math does show up here and there in biology, usually in biophysics and biochemistry. It appears also in genetics, which was pioneered by Br. Gregor Mendel, trained as a physicist be it noted, who conducted a real, no-foolin' designed experiment, the first in all biology. One also sees biostatistics.
But statistics is not mathematics and a regression equation, though it
bears a passing resemblance to a mathematical equation, is not actually
of the same species. Think of it as mimicry. This distinction is a topic
for
another day, except that the softer the science, the worse its
statistical praxis. And when the science is social the praxis gets
downright mushy, usually learned via cookbooks in "Stats 101" courses.
Which brings us to today's topic: correlation.
Ever since David Hume, correlation has
held pride of place over causation due to the inability of inductive
reasoning ever to establish causes. It
establishes only a co-relation between two (or more) variables measured on the
same unit. Thus, it requires:

It is itself a happy¹ illustration of Thucydides' dictum that people
will swallow anything if it accords with their prior beliefs.² Also that
experts who wander off their reservation are no more insightful than
the rest of us fools. Herewith, the evidence in chief as cited by the
True Coyne:
 We note first of all that the author of the graph (who was not Coyne) is unfamiliar with Edward Tufte's classic work, The Visual Display of Quantitative Information. Fair enough, since the display is not, strictly speaking of quantitative information at all.
reifying abstractions: to wit: both happiness and religious.
Countries cannot be "happy" (or "religious"),
only human beings can be either. Perhaps Coyne meant that "the
majority of the people in country X" are happy, but this raises the
question of how this can be known. How were they contacted? By sample?
Was the sample randomized? Stratified? In some countries, folks do not
have telephones; indeed, in some countries they do not have street names
or addresses. In some, they do not have streets. How do you randomly
sample in Burkina Faso? Is it as straightforward as in Singapore? San
Jose, Costa Rica, has streets, but the houses are not numbered. How does
one identify a sampling frame from which to select random units? Did
the data collector even bother to do so? And, if not, in what manner
could the results be generalized from the sample to the target
population? Allow TOF to express Profound Doubts on these points. To
learn that these data were collected by Gallup is encouraging, although
that they were gathered under UN auspices is not.
About 1000 people were surveyed in each country in each year. The
reported happiness results are the combined results for all the years
from 2014-2016. (Although not all countries were surveyed in every
year.) Results from multiple years were combined in order to tighten the
confidence interval via larger nominal sample sizes. A confidence interval
is a mythic figure regarding a parameter of a statistical distribution.
Multiple surveys can be combined in this manner only if there has been
no substantive change in the population during the time when the various
samples were taken, nor any change in the manner of data collection.³
Otherwise, you may be averaging apples and oranges.
hap-o-meter? (Preferably one calibrated to a standard certified by
NIST). This is perhaps more evidently a problem to a physicist than to a
biologist or a social "scientist." The latter in particular is
conditioned
to accept a questionnaire as an "instrument" and to confuse the answers
to a suite of questions with a "measurement." And indeed, so it
happened.
The Happiness Scale was measured [sic] using the Cantril life ladder. The English Language version of the key question runs as follows.
That's right, it's all about feelz.
Note that the life ladder begs the question of what the "best possible
life" means to different people, especially in different cultures. One
easily imagines countries in which the "best possible life" is not very
good at all; but one also imagines situations in which access to
television has introduced formerly happy people to the life of Western
Europeans and the sin of envy, which is defined as unhappiness at the
good fortune of others.
The original survey also asked about other factors, such as: GDP, life expectancy, social support ("If you were in trouble, do you have relatives or friends you can count on to help you whenever you need them, or not?"), generosity ("Have you donated money to a charity in the past month?"), corruption perception ("Is corruption widespread throughout the government [or throughout business] or not") etc. Collectively, the UN Report claims, these factors account for nearly all the variation in happiness in the world.
Ordinal in the Court! The
Happiness Scale is an ordinal scale, not a ratio scale. A response of
"10" on the ladder does not mean that the respondent is twice as happy
as someone answering "5". Not like 10 cm. is twice as long as 5 cm., or
10Ω is twice as resistant as 5Ω. This is an illusion created by the
imagery of the "ladder" and its "rungs." Without a ratio scale, the
whole
procedure of averaging and correlating is bogus from the get-go.⁴
It is not clear what the steps on the "ladder scale" mean. A happiness
of "8" is eight whats? Not volts, TOF is sure. Happiness is said to
"light up a room," so perhaps eight lumens? But TOF doubts it.
Did happiness ratings within a country form a single statistical
population? If not, there may be no average for that country. Consider the paste weights of battery grids
which were made at different times using different batches of paste,
milled fortuitously at different densities. The resulting weights had
two distinct averages, not one: those grids pasted prior to 4:00 PM and
those pasted after the batch change.
 If you stick your head in the oven and your feet in the freezer, on the average you're comfortable.
An average is a measure of central tendency, and not all
processes have a central tendency. In that sense, there is no average, even if you can calculate one.
What is the central tendency of the number of testicles possessed by human beings? But we digress.⁵
Most of the same points apply to the religiosity scale. What exactly is
"importance of religion"? What is meant by a "religion"? Is shamanism even
the same kind of thing as Buddhism? In those countries
possessing established churches, citizens are enrolled in the approved
churches for tax purposes, whether they attend church or not. Does this
count? Does pro forma attendance? Does the devoutness of
the attendees? Who measures such subjective attitudes? How do they do
so?
With what precision? Does "religiosity" mean the same thing in China as
it does in Bolivia?⁶ Some folks like to point out that atheistic
countries like the quondam Soviet Union are "really" religious because
communism is "really" a religion. (See Midgley, Evolution as a Religion for a discussion.)
Notice that an individual may regard "religion" (broadly speaking) as
"important" (broadly speaking) even if he himself is not a believer.
It is not clear what the scale measures, except that it appears to be a
proportion running from 0.00 to 1.00. If so, it is at least a ratio
scale.
These religiosity "data" were not collected in the same survey as
the happiness "data." That is, the X and Y "measurements" were not
performed on the same units. And yet a correlation was performed!
happiness and the religiosity "measured" on the same units (people) or
only within the same geographical region (country)?
Imagine
trying to determine the relationship between the nitrogen content and
tensile strength of steel if the two properties were not measured on
the same heats of steel. Even a biologist might hesitate to rely on such results --
even if he did not notice the metallurgist rolling on the floor
laughing his guts out. As a thought experiment, imagine Coyne's reaction
to a correlation between cancer rates in US census districts versus the usage of lawn
services in those same districts, with no attempt to discover whether
the households experiencing the cancers were the same households
employing the lawn services!
Another
issue to be considered is whether one should treat all countries as
equal units when they vary widely in size: Singapore is small and
compact; Brazil is not.
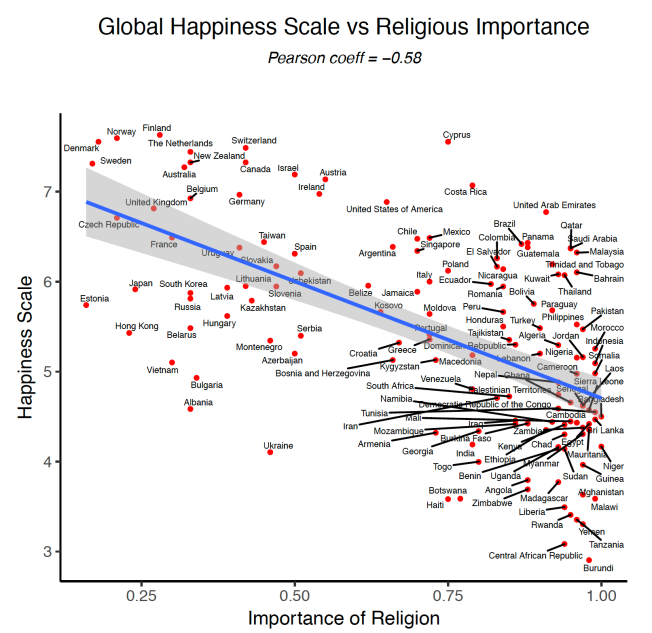
The reported correlation
coefficient is r= ‒0.58. No self-respecting engineer would entertain
such a value or r for a New York minute, although TOF has been told that
soft "scientists" put much stock in any r greater than zero, provided
they have wee p-values. This can be ascribed to their training in
"cookbook statistics". But let it be said that you can have a very high
"confidence" around a very wrong value. A confidence interval is a
statement about the precision of an estimate, not about its accuracy,
let alone its appropriateness. An r= ‒0.58 means an r²=
0.34. This means that only about one-third of the
variation-among-countries
in happiness is "explained" by its association with religiosity of
those countries. (Whatever that means.)
meaningless. Among the assumptions built into the woodwork is the
assumption that the data come from a statistical population. That is,
that the data represent a constant system of common causes. But out in
the wilds, we most often encounter mixtures of populations: units
produced at different times, from different material lots, under
different operational conditions. Sometimes these differences have no
practical effect on the measurement of interest, but sometimes they do.
You cannot leave that to assumption. TOF has seen cases where it
mattered who the operator was who ran the machine, or made the
measurement, or even what time of day. And if these muck up manufactured
product, where the output is supposed to be uniform and to specifications, how much more so wild data which is under no such domesticated obligation?
It is not clear
that the scatterplot is a hot dog or a hamburger with a tail. That is,
the weak appearance of a correlation is due to multiple clusters of
points. The vast majority of points form an amorphous ball on the right.
A second cluster in the northwest consists of Western Europe and a
third cluster in the southwest consists of Eastern Europe and East Asia.
This is a common pattern on scatterplots.
Apparent correlations between X and Y can indeed come about when:
 The
The
correlation in the left hand plot apparently shows that errors decrease
with increasing workload on the clerks. The managers were delighted. To
reduce errors we will give the clerks more work! But wait. There were
two clerks: Adam and Betsy. Betsy was more experienced. She got more
work done and made fewer errors than Adam. There was a causal
relationship, but it was not between X and Y! It was between Z
and X and between Z and Y. (In the actual case, there were four clerks.
The case has been simplified for presentation purposes.)
These
are all technical issues associated with the use of the statistics; but
there are also substantive issues associated with the hypothesis
supposedly being tested.
Everyone gives lip service to
the fact that correlation is not causation, but then turns around and
acts as if it were. The Coynester is no exception to this rule and
chortles over the "fact" that religion does not result in happiness for
its practitioners. (Notice the leap in logic here. That is not even what
the data is supposed to show. These are countries, not people.)
But why should anyone suppose that "religiosity" however defined should
be expected to entail "happiness" however defined? It may be the
opposite case: unhappiness may entail religiosity, at least of certain
types. Recall
Notes
5. lurking cause. A nice article on the subject is Brian Joiner. "Lurking Variables: Some Examples." The American Statistician 35(4): 227-233 (Nov 1981)
Biology is sorely deficient in math when
compared to physics or chemistry, and is therefore a sort of Junior
Varsity member of Team Science -- at least from the 18th century,
Scientific Revolutionary perspective. You may recall that one of the
Pillars of that Revolution was the privileging of Mathematics as the
Language of Discourse for Science. See Descartes for details. (It is
possible to quibble with those details -- after all, if the only tool
you allow yourself is a hammer, all you will ever see is a nail, and by
restricting themselves to what was mathematically "visible," the
Scientists blinded themselves to that which was not measurable.) And so
we have equations for Newton's
Theory, Maxwell's Theory, Boyle's Theory, Einstein's Theory, and sundry
others. But we have, alas, no equations expressing Darwin's Theory.
Fair is fair. Math does show up here and there in biology, usually in biophysics and biochemistry. It appears also in genetics, which was pioneered by Br. Gregor Mendel, trained as a physicist be it noted, who conducted a real, no-foolin' designed experiment, the first in all biology. One also sees biostatistics.
But statistics is not mathematics and a regression equation, though it
bears a passing resemblance to a mathematical equation, is not actually
of the same species. Think of it as mimicry. This distinction is a topic
for
another day, except that the softer the science, the worse its
statistical praxis. And when the science is social the praxis gets
downright mushy, usually learned via cookbooks in "Stats 101" courses.
Which brings us to today's topic: correlation.
Ever since David Hume, correlation has
held pride of place over causation due to the inability of inductive
reasoning ever to establish causes. It
establishes only a co-relation between two (or more) variables measured on the
same unit. Thus, it requires:
- measurements
- on the same units
"There can be no science of any hard empirical variety when the veryAn example recently promoted by "The Gift that Keeps on Giving," a.k.a. Jerry Coyne, is that "the happiest countries are the least religious."
act of identifying one’s object of study is already an act of
interpretation, contingent on a collection of purely arbitrary
reductions, dubious categorizations, and biased observations. There can
be no meaningful application of experimental method. There can be no
correlation established between biological and cultural data."
-- David Bentley Hart, "Daniel Dennett Hunts the Snark"
It is itself a happy¹ illustration of Thucydides' dictum that people
will swallow anything if it accords with their prior beliefs.² Also that
experts who wander off their reservation are no more insightful than
the rest of us fools. Herewith, the evidence in chief as cited by the
True Coyne:
Notes:
1. happy. Lucky, fortunate. See also mayhap, happen, happening, happenstance; also hapless.
2. Thucydudes, History of the Peloponnesian War, Book IV, 108
Happy, Happy! Joy, Joy!
The Coynester has committed the scientific gaffe ofreifying abstractions: to wit: both happiness and religious.
Countries cannot be "happy" (or "religious"),
only human beings can be either. Perhaps Coyne meant that "the
majority of the people in country X" are happy, but this raises the
question of how this can be known. How were they contacted? By sample?
Was the sample randomized? Stratified? In some countries, folks do not
have telephones; indeed, in some countries they do not have street names
or addresses. In some, they do not have streets. How do you randomly
sample in Burkina Faso? Is it as straightforward as in Singapore? San
Jose, Costa Rica, has streets, but the houses are not numbered. How does
one identify a sampling frame from which to select random units? Did
the data collector even bother to do so? And, if not, in what manner
could the results be generalized from the sample to the target
population? Allow TOF to express Profound Doubts on these points. To
learn that these data were collected by Gallup is encouraging, although
that they were gathered under UN auspices is not.
About 1000 people were surveyed in each country in each year. The
reported happiness results are the combined results for all the years
from 2014-2016. (Although not all countries were surveyed in every
year.) Results from multiple years were combined in order to tighten the
confidence interval via larger nominal sample sizes. A confidence interval
is a mythic figure regarding a parameter of a statistical distribution.
Multiple surveys can be combined in this manner only if there has been
no substantive change in the population during the time when the various
samples were taken, nor any change in the manner of data collection.³
Otherwise, you may be averaging apples and oranges.
Notes.Next, how do you measure "happiness"? With a
3. combining surveys.
For example, suppose in the prior year there had been much anticipation
that candidate X would be elected and usher in the eschaton because the
Opposing Party had been cozened into nominating a Bull Goose Loser. But
then in the following year, the Bull Goose Loser unaccountably has won the
election, causing much weeping and tooth-gnashing. There might be a
sea change in happiness, at least within some strata of the population.
hap-o-meter? (Preferably one calibrated to a standard certified by
NIST). This is perhaps more evidently a problem to a physicist than to a
biologist or a social "scientist." The latter in particular is
conditioned
to accept a questionnaire as an "instrument" and to confuse the answers
to a suite of questions with a "measurement." And indeed, so it
happened.
The Happiness Scale was measured [sic] using the Cantril life ladder. The English Language version of the key question runs as follows.
“Please imagine a ladder, with steps numbered from 0 at the bottom to 10
at the top. The top of the ladder represents the best possible life for
you and the bottom of the ladder represents the worst possible life for
you. On which step of the ladder would you say you personally feel you
stand at this time?
That's right, it's all about feelz.
Note that the life ladder begs the question of what the "best possible
life" means to different people, especially in different cultures. One
easily imagines countries in which the "best possible life" is not very
good at all; but one also imagines situations in which access to
television has introduced formerly happy people to the life of Western
Europeans and the sin of envy, which is defined as unhappiness at the
good fortune of others.
The original survey also asked about other factors, such as: GDP, life expectancy, social support ("If you were in trouble, do you have relatives or friends you can count on to help you whenever you need them, or not?"), generosity ("Have you donated money to a charity in the past month?"), corruption perception ("Is corruption widespread throughout the government [or throughout business] or not") etc. Collectively, the UN Report claims, these factors account for nearly all the variation in happiness in the world.
Looking ahead, none of these factors included "religiosity." Hence,Ho, ho. TOF jests. One meaningless social science exercise does not forestall another.
there was no "room" in the model for religion to account for happiness
positively or negatively. Naturally, this stopped Coyne and his
religious enthusiasts in their tracks.
Ordinal in the Court! The
Happiness Scale is an ordinal scale, not a ratio scale. A response of
"10" on the ladder does not mean that the respondent is twice as happy
as someone answering "5". Not like 10 cm. is twice as long as 5 cm., or
10Ω is twice as resistant as 5Ω. This is an illusion created by the
imagery of the "ladder" and its "rungs." Without a ratio scale, the
whole
procedure of averaging and correlating is bogus from the get-go.⁴
It is not clear what the steps on the "ladder scale" mean. A happiness
of "8" is eight whats? Not volts, TOF is sure. Happiness is said to
"light up a room," so perhaps eight lumens? But TOF doubts it.
Did happiness ratings within a country form a single statistical
population? If not, there may be no average for that country. Consider the paste weights of battery grids
which were made at different times using different batches of paste,
milled fortuitously at different densities. The resulting weights had
two distinct averages, not one: those grids pasted prior to 4:00 PM and
those pasted after the batch change.

An average is a measure of central tendency, and not all
processes have a central tendency. In that sense, there is no average, even if you can calculate one.
What is the central tendency of the number of testicles possessed by human beings? But we digress.⁵
NotesHoly Mackerel!
4. ratio scale. See Deming, The Statistical Adjustment of Data for discussion.
5. testicles. The average is just less than one. Half of all
humans have zero. The other half usually have two, but there are
occasional accidents and elective surgeries.
Most of the same points apply to the religiosity scale. What exactly is
"importance of religion"? What is meant by a "religion"? Is shamanism even
the same kind of thing as Buddhism? In those countries
possessing established churches, citizens are enrolled in the approved
churches for tax purposes, whether they attend church or not. Does this
count? Does pro forma attendance? Does the devoutness of
the attendees? Who measures such subjective attitudes? How do they do
so?
With what precision? Does "religiosity" mean the same thing in China as
it does in Bolivia?⁶ Some folks like to point out that atheistic
countries like the quondam Soviet Union are "really" religious because
communism is "really" a religion. (See Midgley, Evolution as a Religion for a discussion.)
Notice that an individual may regard "religion" (broadly speaking) as
"important" (broadly speaking) even if he himself is not a believer.
It is not clear what the scale measures, except that it appears to be a
proportion running from 0.00 to 1.00. If so, it is at least a ratio
scale.
These religiosity "data" were not collected in the same survey as
the happiness "data." That is, the X and Y "measurements" were not
performed on the same units. And yet a correlation was performed!
Notes
6. cross-country comparisons should be made with great care because different countries often use different operational definitions of the variables. Infant mortality is a well-known example. Even within a country, definitions sometimes change. See the discussion sections in the Historical Abstracts of the United States for examples.
Rules of Engagement
A vital issue: Were thehappiness and the religiosity "measured" on the same units (people) or
only within the same geographical region (country)?
Imagine
trying to determine the relationship between the nitrogen content and
tensile strength of steel if the two properties were not measured on
the same heats of steel. Even a biologist might hesitate to rely on such results --
even if he did not notice the metallurgist rolling on the floor
laughing his guts out. As a thought experiment, imagine Coyne's reaction
to a correlation between cancer rates in US census districts versus the usage of lawn
services in those same districts, with no attempt to discover whether
the households experiencing the cancers were the same households
employing the lawn services!
Another
issue to be considered is whether one should treat all countries as
equal units when they vary widely in size: Singapore is small and
compact; Brazil is not.
The reported correlation
coefficient is r= ‒0.58. No self-respecting engineer would entertain
such a value or r for a New York minute, although TOF has been told that
soft "scientists" put much stock in any r greater than zero, provided
they have wee p-values. This can be ascribed to their training in
"cookbook statistics". But let it be said that you can have a very high
"confidence" around a very wrong value. A confidence interval is a
statement about the precision of an estimate, not about its accuracy,
let alone its appropriateness. An r= ‒0.58 means an r²=
0.34. This means that only about one-third of the
variation-among-countries
in happiness is "explained" by its association with religiosity of
those countries. (Whatever that means.)
Hot Dogs and Hamburgers
A correlation coefficient, so beloved by soft "scientists" is almostmeaningless. Among the assumptions built into the woodwork is the
assumption that the data come from a statistical population. That is,
that the data represent a constant system of common causes. But out in
the wilds, we most often encounter mixtures of populations: units
produced at different times, from different material lots, under
different operational conditions. Sometimes these differences have no
practical effect on the measurement of interest, but sometimes they do.
You cannot leave that to assumption. TOF has seen cases where it
mattered who the operator was who ran the machine, or made the
measurement, or even what time of day. And if these muck up manufactured
product, where the output is supposed to be uniform and to specifications, how much more so wild data which is under no such domesticated obligation?
It is not clear
that the scatterplot is a hot dog or a hamburger with a tail. That is,
the weak appearance of a correlation is due to multiple clusters of
points. The vast majority of points form an amorphous ball on the right.
A second cluster in the northwest consists of Western Europe and a
third cluster in the southwest consists of Eastern Europe and East Asia.
This is a common pattern on scatterplots.
Apparent correlations between X and Y can indeed come about when:
- X is a cause of Y
- Y is a cause of X
- Z is a lurking cause⁵ of both X and Y
- coincidence

correlation in the left hand plot apparently shows that errors decrease
with increasing workload on the clerks. The managers were delighted. To
reduce errors we will give the clerks more work! But wait. There were
two clerks: Adam and Betsy. Betsy was more experienced. She got more
work done and made fewer errors than Adam. There was a causal
relationship, but it was not between X and Y! It was between Z
and X and between Z and Y. (In the actual case, there were four clerks.
The case has been simplified for presentation purposes.)
These
are all technical issues associated with the use of the statistics; but
there are also substantive issues associated with the hypothesis
supposedly being tested.
Everyone gives lip service to
the fact that correlation is not causation, but then turns around and
acts as if it were. The Coynester is no exception to this rule and
chortles over the "fact" that religion does not result in happiness for
its practitioners. (Notice the leap in logic here. That is not even what
the data is supposed to show. These are countries, not people.)
But why should anyone suppose that "religiosity" however defined should
be expected to entail "happiness" however defined? It may be the
opposite case: unhappiness may entail religiosity, at least of certain
types. Recall
Notes
5. lurking cause. A nice article on the subject is Brian Joiner. "Lurking Variables: Some Examples." The American Statistician 35(4): 227-233 (Nov 1981)
